class: center middle main-title section-title-7 # Measurement<br>and DAGs .class-info[ **Session 4** .light[PMAP 8521: Program evaluation<br> Andrew Young School of Policy Studies ] ] --- name: outline class: title title-inv-8 # Plan for today -- .box-4.medium.sp-after-half[Abstraction, stretching,<br>and validity] -- .box-6.medium.sp-after-half[Causal models] -- .box-5.medium[Paths, doors, and adjustment] --- name: abstraction class: center middle section-title section-title-4 animated fadeIn # Abstraction, stretching,<br>and validity --- layout: true class: title title-4 --- # Indicators .pull-left[ .box-4.medium[Inputs, activities,<br>and outputs] .box-inv-4[Generally directly measurable] .box-inv-4[\# of citations mailed,<br>% increase in grades, etc.] ] -- .pull-right[ .box-4.medium[Outcomes] .box-inv-4[Harder to measure directly] .box-inv-4[Loftier and more abstract] .box-inv-4[Commitment to school,<br>reduced risk factors] ] --- layout: false .box-4.large.sp-after[How do you measure<br>abstract outcomes?] -- .box-inv-4.large[Move up the ladder of abstraction.] --- .center[ <figure> <img src="img/04/monty-python-witch.jpg" alt="Witch scene from Monty Python and the Holy Grail" title="Witch scene from Monty Python and the Holy Grail" width="80%"> </figure> ] ??? https://www.youtube.com/watch?v=yp_l5ntikaU --- layout: false class: bg-full background-image: url("img/04/witches.jpg") ??? Here's a dataset of witches. What are the common features across witches in general? Are these criteria useful if certain cases don’t fit like Sabrina? What are the most important elements here? Doing magic + being female – that’s good, probably – covers Hermione and HP world --- layout: true class: title title-4 --- # Conceptual stretching .center[ <figure> <img src="img/04/stretching.jpg" alt="Magical women who aren't witches" title="Magical women who aren't witches" width="100%"> </figure> ] ??? But now the concept is stretched too far – this includes all magical female creatures, like trolls and goblins Too much conceptual stretching --- # Ladder of abstraction for witches -- .box-inv-4.small[Mammal] -- .box-inv-4.small[Enmagicked] .box-4.tiny[Trolls, elves, gods/goddesses] -- .box-inv-4.small[Female] .box-4.tiny[Arwen, Winky, Athena] -- .box-inv-4.small[Human] -- .pull-left[ .pull-left[ .box-inv-4.small[Young] .box-4.tiny[Salem witch trials] ] .pull-right[ .box-inv-4.small[Student] .box-4.tiny[Hermione Granger,<br>Sabrina Spellman] ] ] -- .pull-right[ .box-inv-4.small[Old] .box-4.tiny[Elphaba, Halloween decorations] ] --- # Connection to theory .pull-left[ <figure> <img src="img/04/trials-1.jpg" alt="Salem witch trials" title="Salem witch trials" width="100%"> </figure> ] .pull-right[ <figure> <img src="img/04/trials-2.jpg" alt="Salem witch trials" title="Salem witch trials" width="100%"> </figure> ] ??? Accusations typically targeted successful women; women who worked with medicine; women who posed a threat to the patriarchy. In real life, it was a misogynistic tool for maintaining social order. What went wrong? The theory was wrong, yes, but also the indicators weren’t connected to reality --- # Outcomes and programs .box-4.medium[Outcome variable] .box-inv-4.sp-after-half.SMALL[Thing you're measuring] -- .box-4.medium[Outcome change] .box-inv-4.sp-after-half.SMALL[∆ in thing you're measuring over time] -- .box-4.medium[Program effect] .box-inv-4.SMALL[∆ in thing you're measuring over time *because of* the program] --- # Outcomes and programs <figure> <img src="img/04/program-effect.png" alt="Outcomes and program effect" title="Outcomes and program effect" width="100%"> </figure> --- # Connecting measurment to programs .box-inv-4.medium.sp-after-half[Measurable definition of program effect] -- .box-inv-4.medium.sp-after-half[Ideal measurement] -- .box-inv-4.medium.sp-after-half[Feasible measurement] -- .box-inv-4.medium[Connection to real world] --- layout: false name: causal-models class: center middle section-title section-title-6 animated fadeIn # Causal models --- layout: true class: title title-6 --- # Types of data .pull-left[ .box-inv-6.medium[Experimental] .box-6[You have control over which units get treatment] ] -- .pull-right[ .box-inv-6.medium[Observational] .box-6[You don't have control over which units get treatment] ] -- .box-inv-6.medium.sp-before[Which kind lets you prove causation?] --- # Causation with observational data .box-inv-6.medium.sp-after[Can you prove causation<br>with observational data?] -- .box-inv-6.medium[Why is it so controversial<br>to use observational data?] --- layout: false class: bg-full background-image: url("img/04/too-much-rct.jpg") --- layout: true class: title title-6 --- # The causal revolution .pull-left-narrow[ <figure> <img src="img/01/book-of-why.jpg" alt="The Book of Why" title="The Book of Why" width="100%"> </figure> ] .pull-right-wide.center[ <figure> <img src="img/01/judea-pearl.jpg" alt="Judea Pearl" title="Judea Pearl" width="90%"> </figure> ] --- # Causal diagrams .box-inv-6.medium[Directed acyclic graphs (DAGs)] .pull-left[ .box-6.SMALL[**Directed**: Each node has an arrow that points to another node] .box-6.SMALL[**Acyclic**: You can't cycle back to a node (and arrows only have one direction)] .box-6.SMALL[**Graph**: It's… um… a graph] ] .pull-right[ <img src="04-slides_files/figure-html/simple-dag-1.png" width="100%" style="display: block; margin: auto;" /> ] --- # Causal diagrams .box-inv-6.medium[Directed acyclic graphs (DAGs)] .pull-left[ .box-6.SMALL[Graphical model of the process that generates the data] .box-6.SMALL[Maps your philosophical model] .box-6.SMALL[Fancy math ("*do*-calculus") tells you what to control for to isolate and identify causation] ] .pull-right[ 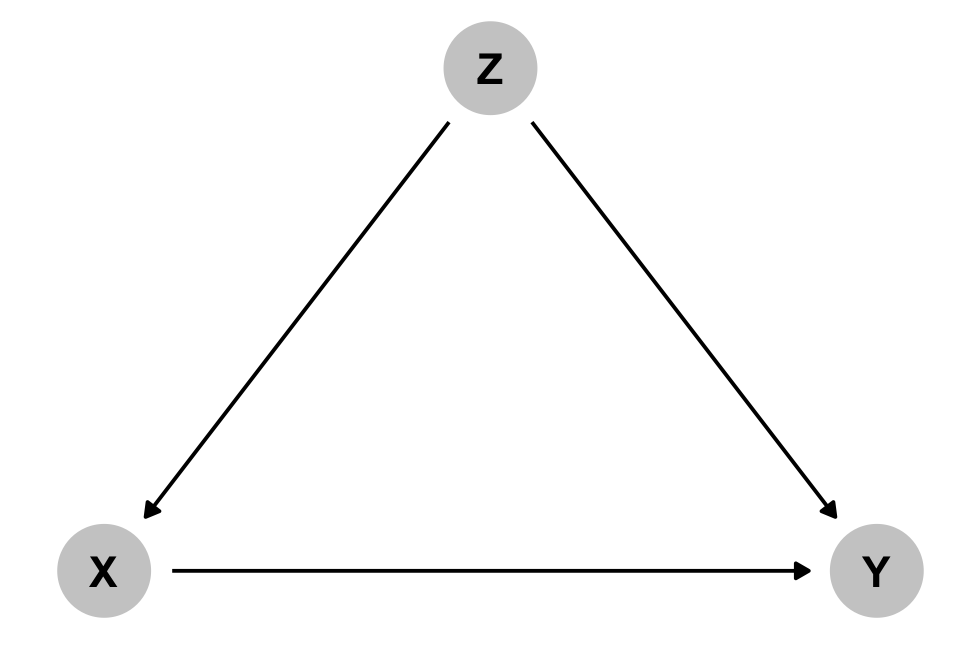 ] --- # Acyclicalness .box-inv-6[What if there's something that really is cyclical?] -- .box-6[Wealth → Power → Wealth] -- .box-6.sp-after[**This isn't acyclic!**<br>Wealth ↔ Power] -- .box-inv-6[Split the node into different time periods] -- .box-6[Wealth<sub>*t* - 1</sub> → Power<sub>*t*</sub> → Wealth<sub>*t*</sub>] --- # How to draw a DAG .box-inv-6.medium[What is the causal effect of an<br>additional year of education on earnings?] -- .box-6[Step 1: List variables] -- .box-6[Step 2: Simplify] -- .box-6[Step 3: Connect arrows] -- .box-6[Step 4: Use logic and math to determine<br>which nodes and arrows to measure] --- # 1. List variables .box-6.sp-after[Education (treatment) → Earnings (outcome)] .center.float-left.sp-after-half[ .box-inv-6[Location] .box-inv-6[Ability] .box-inv-6[Demographics] ] .center.float-left.sp-after-half[ .box-inv-6[Socioeonomic status] .box-inv-6[Year of birth] ] .center.float-left[ .box-inv-6[Compulsory schooling laws] .box-inv-6[Job connections] ] --- # 2. Simplify .box-6.sp-after[Education (treatment) → Earnings (outcome)] .center.float-left.sp-after-half[ .box-inv-6[Location] .box-inv-3[Ability] .box-inv-3[Demographics] ] .center.float-left.sp-after-half[ .box-inv-3[Socioeonomic status] .box-inv-6[Year of birth] ] .center.float-left[ .box-inv-6[Compulsory schooling laws] .box-inv-6[Job connections] ] .box-inv-5[Background] --- # 3. Draw arrows .pull-left-narrow[ .box-inv-6[Education causes earnings] ] .pull-right-wide[ <img src="04-slides_files/figure-html/edu-earn-simple-1.png" width="100%" style="display: block; margin: auto;" /> ] --- # 3. Draw arrows .pull-left-narrow[ .box-inv-6[Background, year of birth, location, job connections, and school requirements all cause education] ] .pull-right-wide[ <img src="04-slides_files/figure-html/edu-earn-2-1.png" width="100%" style="display: block; margin: auto;" /> ] --- # 3. Draw arrows .pull-left-narrow[ .box-inv-6[Background, year of birth, and location all cause earnings too] ] .pull-right-wide[ <img src="04-slides_files/figure-html/edu-earn-3-1.png" width="100%" style="display: block; margin: auto;" /> ] --- # 3. Draw arrows .pull-left-narrow[ .box-inv-6[Education causes job earnings] ] .pull-right-wide[ <img src="04-slides_files/figure-html/edu-earn-4-1.png" width="100%" style="display: block; margin: auto;" /> ] --- # 3. Draw arrows .pull-left-narrow[ .box-inv-6[Location and background are probably related, but neither causes the other. Something unobservable (U1) does that.] ] .pull-right-wide[ <img src="04-slides_files/figure-html/edu-earn-full-1.png" width="100%" style="display: block; margin: auto;" /> ] --- # Let the computer do this! .box-inv-6.large.sp-after-half[dagitty.net] .box-inv-6.large[**ggdag** package in R] --- layout: false name: paths-doors-adjustment class: center middle section-title section-title-5 animated fadeIn # Paths, doors,<br>and adjustment --- layout: true class: title title-5 --- # Causal identification .pull-left-narrow[ .box-inv-5[All these nodes are related; there's correlation between them all] .box-inv-5[We care about Edu → Earn, but what do we do about all the other nodes?] ] .pull-right-wide[ 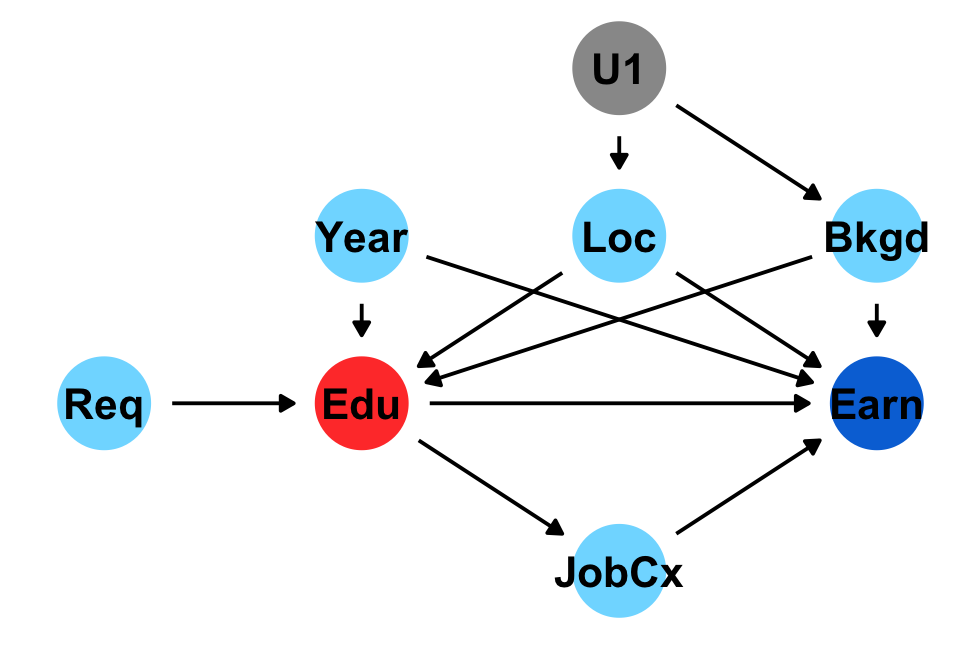 ] --- # Causal identification .box-inv-5.medium[A causal effect is *identified* if the association between treatment and outcome is propertly stripped and isolated] --- # Paths and associations .box-inv-5.medium[Arrows in a DAG transmit associations] .box-inv-5.medium[You can redirect and control those paths by "adjusting" or "conditioning"] --- # Three types of associations .pull-left-3[ .box-5.medium[Confounding] <img src="04-slides_files/figure-html/confounding-dag-1.png" width="100%" style="display: block; margin: auto;" /> .box-inv-5.small[Common cause] ] .pull-middle-3.center[ .box-5.medium[Causation] <img src="04-slides_files/figure-html/mediation-dag-1.png" width="100%" style="display: block; margin: auto;" /> .box-inv-5.small[Mediation] ] .pull-right-3[ .box-5.medium[Collision] <img src="04-slides_files/figure-html/collision-dag-1.png" width="100%" style="display: block; margin: auto;" /> .box-inv-5.small[Selection /<br>endogeneity] ] --- # Confounding .pull-left-wide[ <img src="04-slides_files/figure-html/confounding-dag-big-1.png" width="100%" style="display: block; margin: auto;" /> ] .pull-right-narrow[ .box-inv-5.medium[**X** causes **Y**] .box-inv-5.medium[But **Z** causes both **X** and **Y**] .box-inv-5.medium[**Z** * confounds* the **X** → **Y** association] ] --- # Paths .pull-left-wide[ 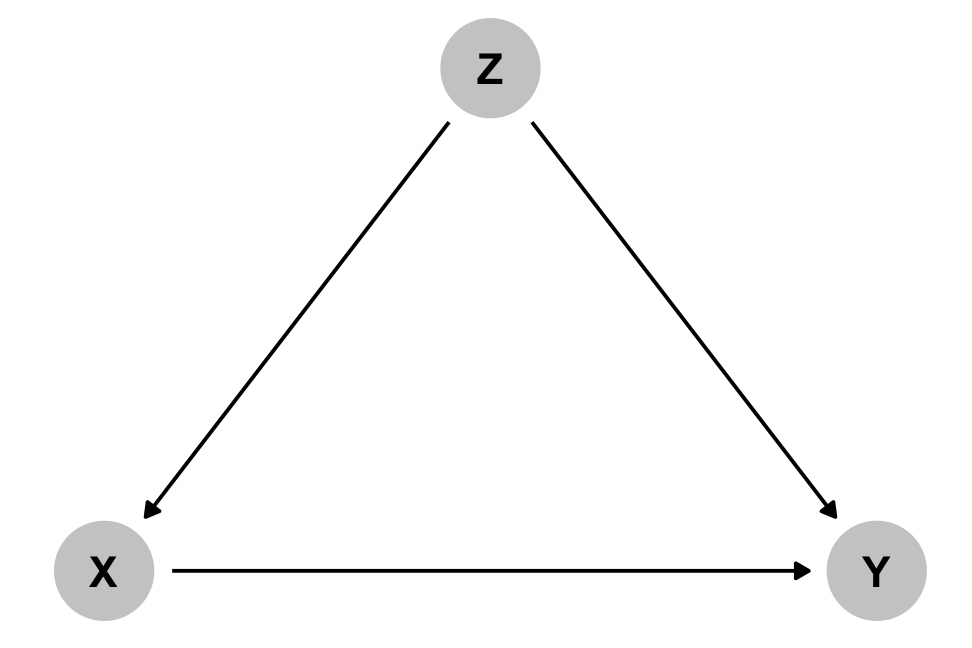 ] .pull-right-narrow[ .box-inv-5[Paths between<br>**X** and **Y**?] .box-5[**X** → **Y**] .box-5[**X** ← **Z** → **Y**] .box-inv-5.medium[**Z** is a *backdoor*] ] --- # *d*-connection .pull-left-wide[  ] .pull-right-narrow[ .box-inv-5[**X** and **Y** are<br>"*d*-connected" because associations can pass through **Z**] .box-5[The relationship between **X** and **Y** is not identified / isolated] ] --- # Effect of money on elections .box-inv-5.medium[What are the paths<br>between **money** and **win margin**?] .pull-left[ <img src="04-slides_files/figure-html/money-elections-1.png" width="100%" style="display: block; margin: auto;" /> ] -- .pull-right[ .box-5[Money → Margin] .box-5[Money ← Quality → Margin] .box-inv-5[Quality is a *backdoor*] ] --- # Closing doors .pull-left[ <img src="04-slides_files/figure-html/confounding-dag-adjusted-1.png" width="100%" style="display: block; margin: auto;" /> ] .pull-right[ .box-inv-5.medium[Close the backdoor by adjusting for **Z**] ] --- # Closing doors .pull-left[ .box-inv-5.small[Find the part of campaign money that is explained by quality, remove it.<br>This is the residual part of money.] .box-inv-5.small[Find the part of win margin that is explained by quality, remove it. This is the residual part of win margin.] .box-inv-5.small[Find the relationship between the residual part of money and residual part of win margin.<br>**This is the causal effect**.] ] .pull-right[ <img src="04-slides_files/figure-html/money-elections-adjusted-1.png" width="100%" style="display: block; margin: auto;" /> ] --- # Closing doors .pull-left[ .box-inv-5[Compare candidates as if they had the same quality] .box-inv-5[Remove differences that are predicted by quality] .box-inv-5[Hold quality constant] ] .pull-right[ 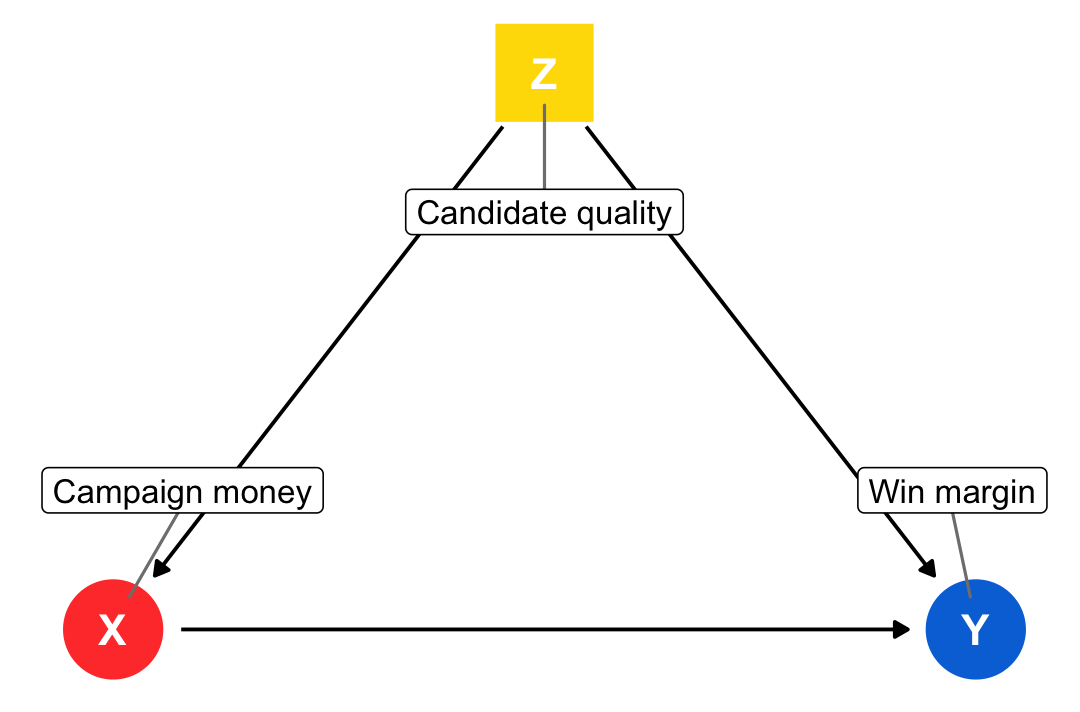 ] --- # How to adjust .box-inv-5.medium[Include term in regression] $$ `\begin{aligned} \text{Win margin} =& \beta_0 + \beta_1 \text{Campaign money} +\\ & \beta_2 \text{Candidate quality} + \varepsilon \end{aligned}` $$ .center.float-left[ .box-inv-5.medium[Matching] .box-inv-5.medium[Stratifying] .box-inv-5.medium.sp-before-half[Inverse probability weighting] ] --- # *d*-separation .pull-left[ 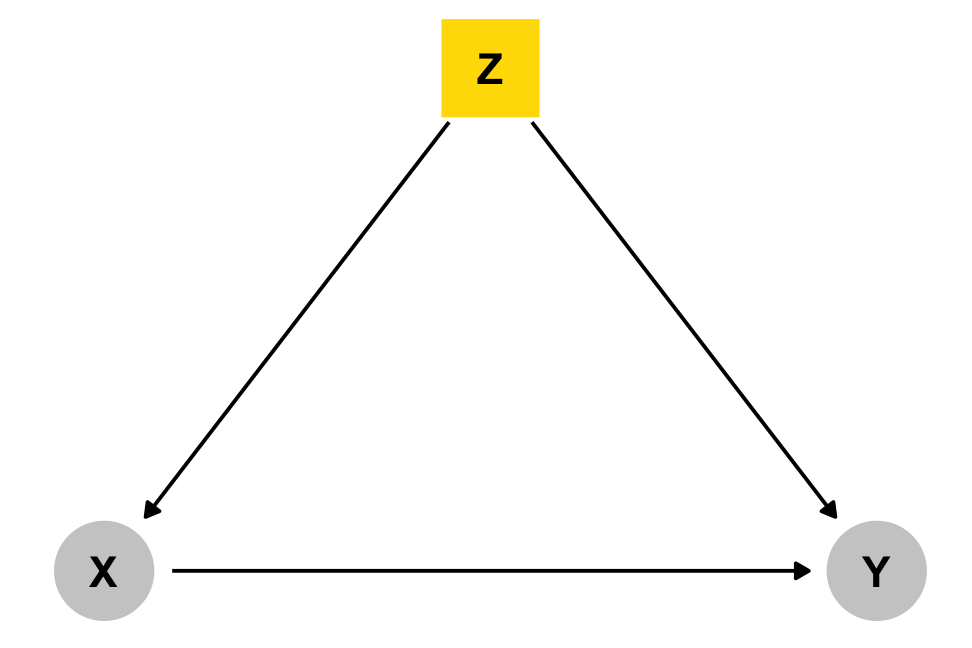 ] .pull-right[ .box-inv-5.medium[If we control for **Z**,<br>**X** and **Y** are now<br>"*d*-separated" and the association is isolated!] ] --- # Closing backdoors .pull-left-narrow[ .box-inv-5[Block all backdoor paths to identify the main pathway you care about] ] .pull-right-wide[  ] --- # All paths .pull-left.left[ .box-5.smaller[Education → Earnings] .box-5.smaller[Education → Job connections → Earnings] .box-7.smaller[Education ← Background → Earnings] .box-7.smaller[Education ← Background ← U1 → Location → Earnings] .box-7.smaller[Education ← Location → Earnings] .box-7.smaller[Education ← Location ← U1 → Background → Earnings] .box-7.smaller[Education ← Year → Earnings] ] .pull-right[  ] --- # All paths .pull-left-narrow[ .box-inv-5[Adjust for **Location**, **Background** and **Year** to isolate the **Education → Earnings** causal effect] ] .pull-right-wide[ <img src="04-slides_files/figure-html/edu-earn-adjust-1.png" width="100%" style="display: block; margin: auto;" /> ] --- # Let the computer do this! .box-inv-5.large.sp-after-half[dagitty.net] .box-inv-5.large[The **ggdag** and **dagitty**<br>packages in R] --- # How do you know if this is right? .pull-left-narrow[ .box-inv-5[You can test the implications of the model to see if they're right in your data] $$ X \perp Y\ |\ Z $$ .box-5.small[X is independent of Y, given Z] ] .pull-right-wide[ <figure> <img src="img/04/dagitty-implications.png" alt="Dagitty implications" title="Dagitty implications" width="100%"> </figure> ] --- # Causation .pull-left-wide[ <img src="04-slides_files/figure-html/causation-dag-big-1.png" width="100%" style="display: block; margin: auto;" /> ] .pull-right-narrow[ .box-inv-5.medium[**X** causes **Y**] .box-inv-5.medium[**X** causes<br>**Z** which causes **Y**] .box-5.medium[Should you control for **Z**?] ] --- # Causation .pull-left-wide[ 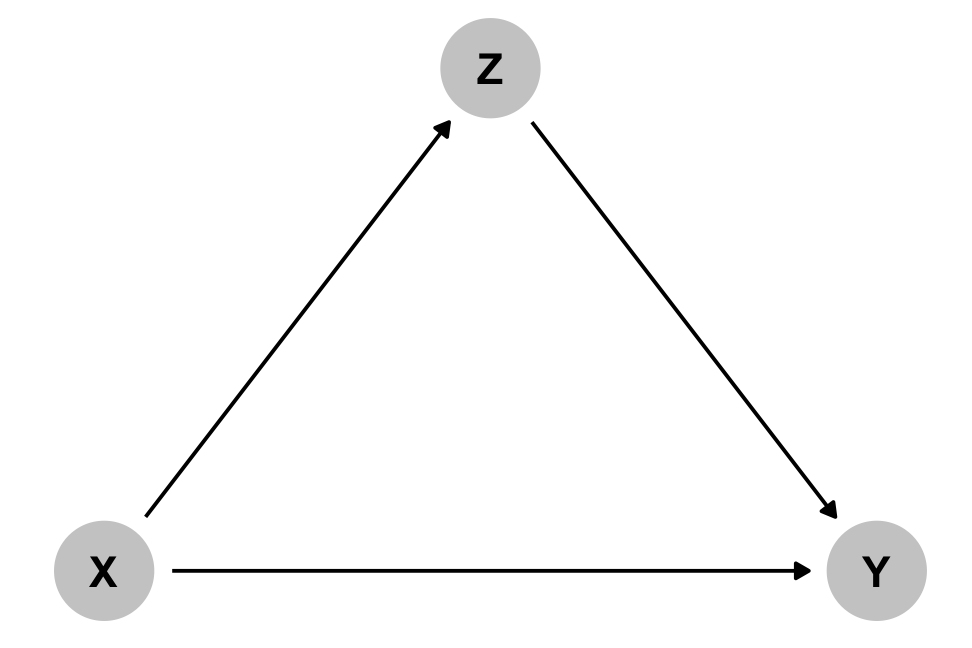 ] .pull-right-narrow[ .box-5.medium[Should you control for **Z**?] .box-inv-5.medium[No!] .box-inv-5[Overcontrolling] ] --- # Causation and overcontrolling .pull-left-wide[  ] .pull-right-narrow[ .box-inv-5[Should you control for job connections?] ] --- # Colliders .pull-left-wide[ <img src="04-slides_files/figure-html/collider-dag-big-1.png" width="100%" style="display: block; margin: auto;" /> ] .pull-right-narrow[ .box-inv-5.medium[**X** causes **Z**] .box-inv-5.medium[**Y** causes **Z**] .box-5.medium[Should you control for **Z**?] ] --- # Programming and social skills .box-inv-5.medium[Do programming skills reduce social skills?] .pull-left[ <img src="04-slides_files/figure-html/programming-social-skills-1.png" width="100%" style="display: block; margin: auto;" /> ] -- .pull-right[ .box-5[You go to a tech company and conduct a survey. You find a negative relationship!<br>Is it real?] ] --- # Programming and social skills .box-inv-5.medium[Do programming skills reduce social skills?] .pull-left[ 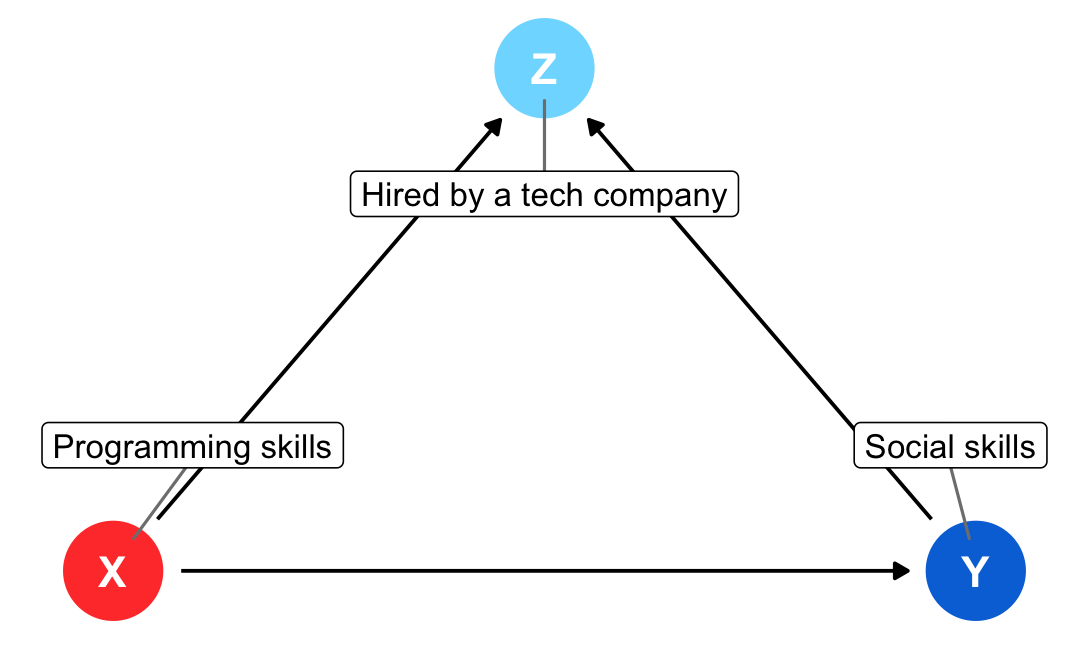 ] .pull-right[ .box-5[No! **Hired by a tech company** is a collider and we controlled for it.] .box-5[This inadvertently connected the two.] ] --- layout: false .pull-left[ .box-5.medium[Colliders can create<br>fake causal effects] ] .pull-right[ .box-5.medium[Colliders can hide<br>real causal effects] ] <img src="04-slides_files/figure-html/bulls-scores-1.png" width="50%" style="display: block; margin: auto;" /> .center[ .box-inv-5[Height is unrelated to basketball skill… among NBA players] ] --- layout: true class: title title-5 --- # Colliders and selection bias <img src="04-slides_files/figure-html/nba-dag-1.png" width="65%" style="display: block; margin: auto;" /> --- # Three types of associations .pull-left-3[ .box-5.medium[Confounding] 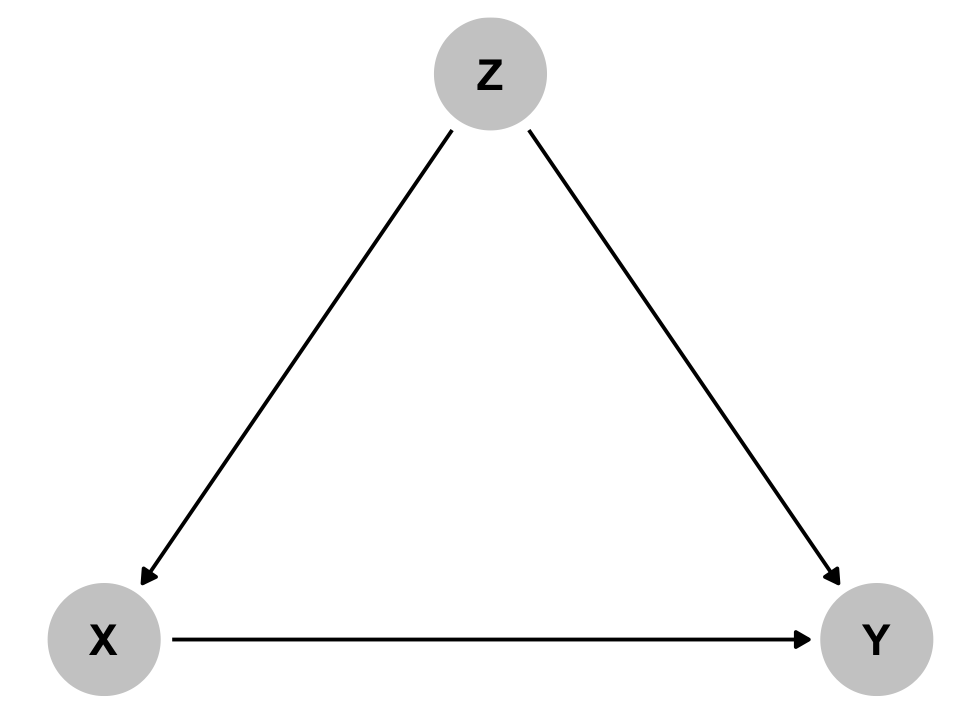 .box-inv-5.small[Common cause] ] .pull-middle-3[ .box-5.medium[Causation] 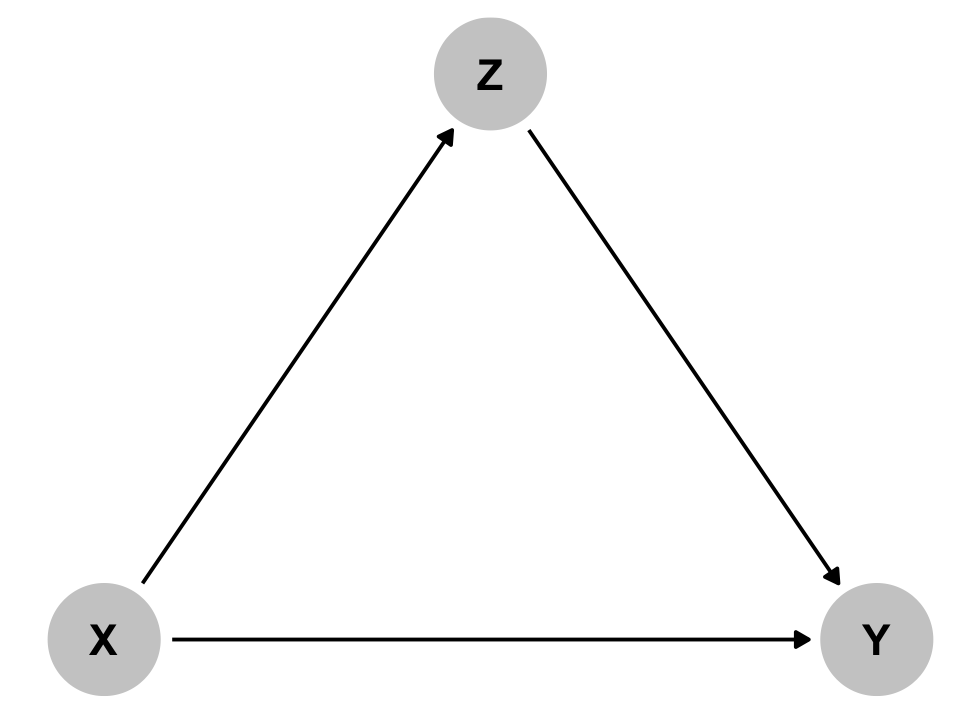 .box-inv-5.small[Mediation] ] .pull-right-3[ .box-5.medium[Collision] 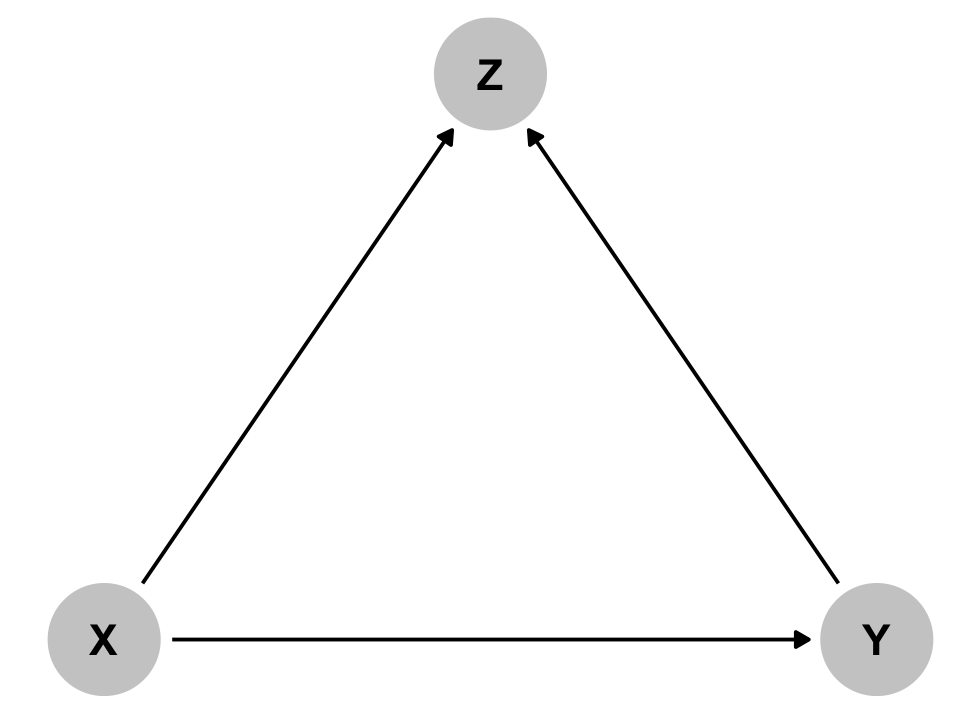 .box-inv-5.small[Selection /<br>endogeneity] ]